EXAMPLE TASK
Bring sources together
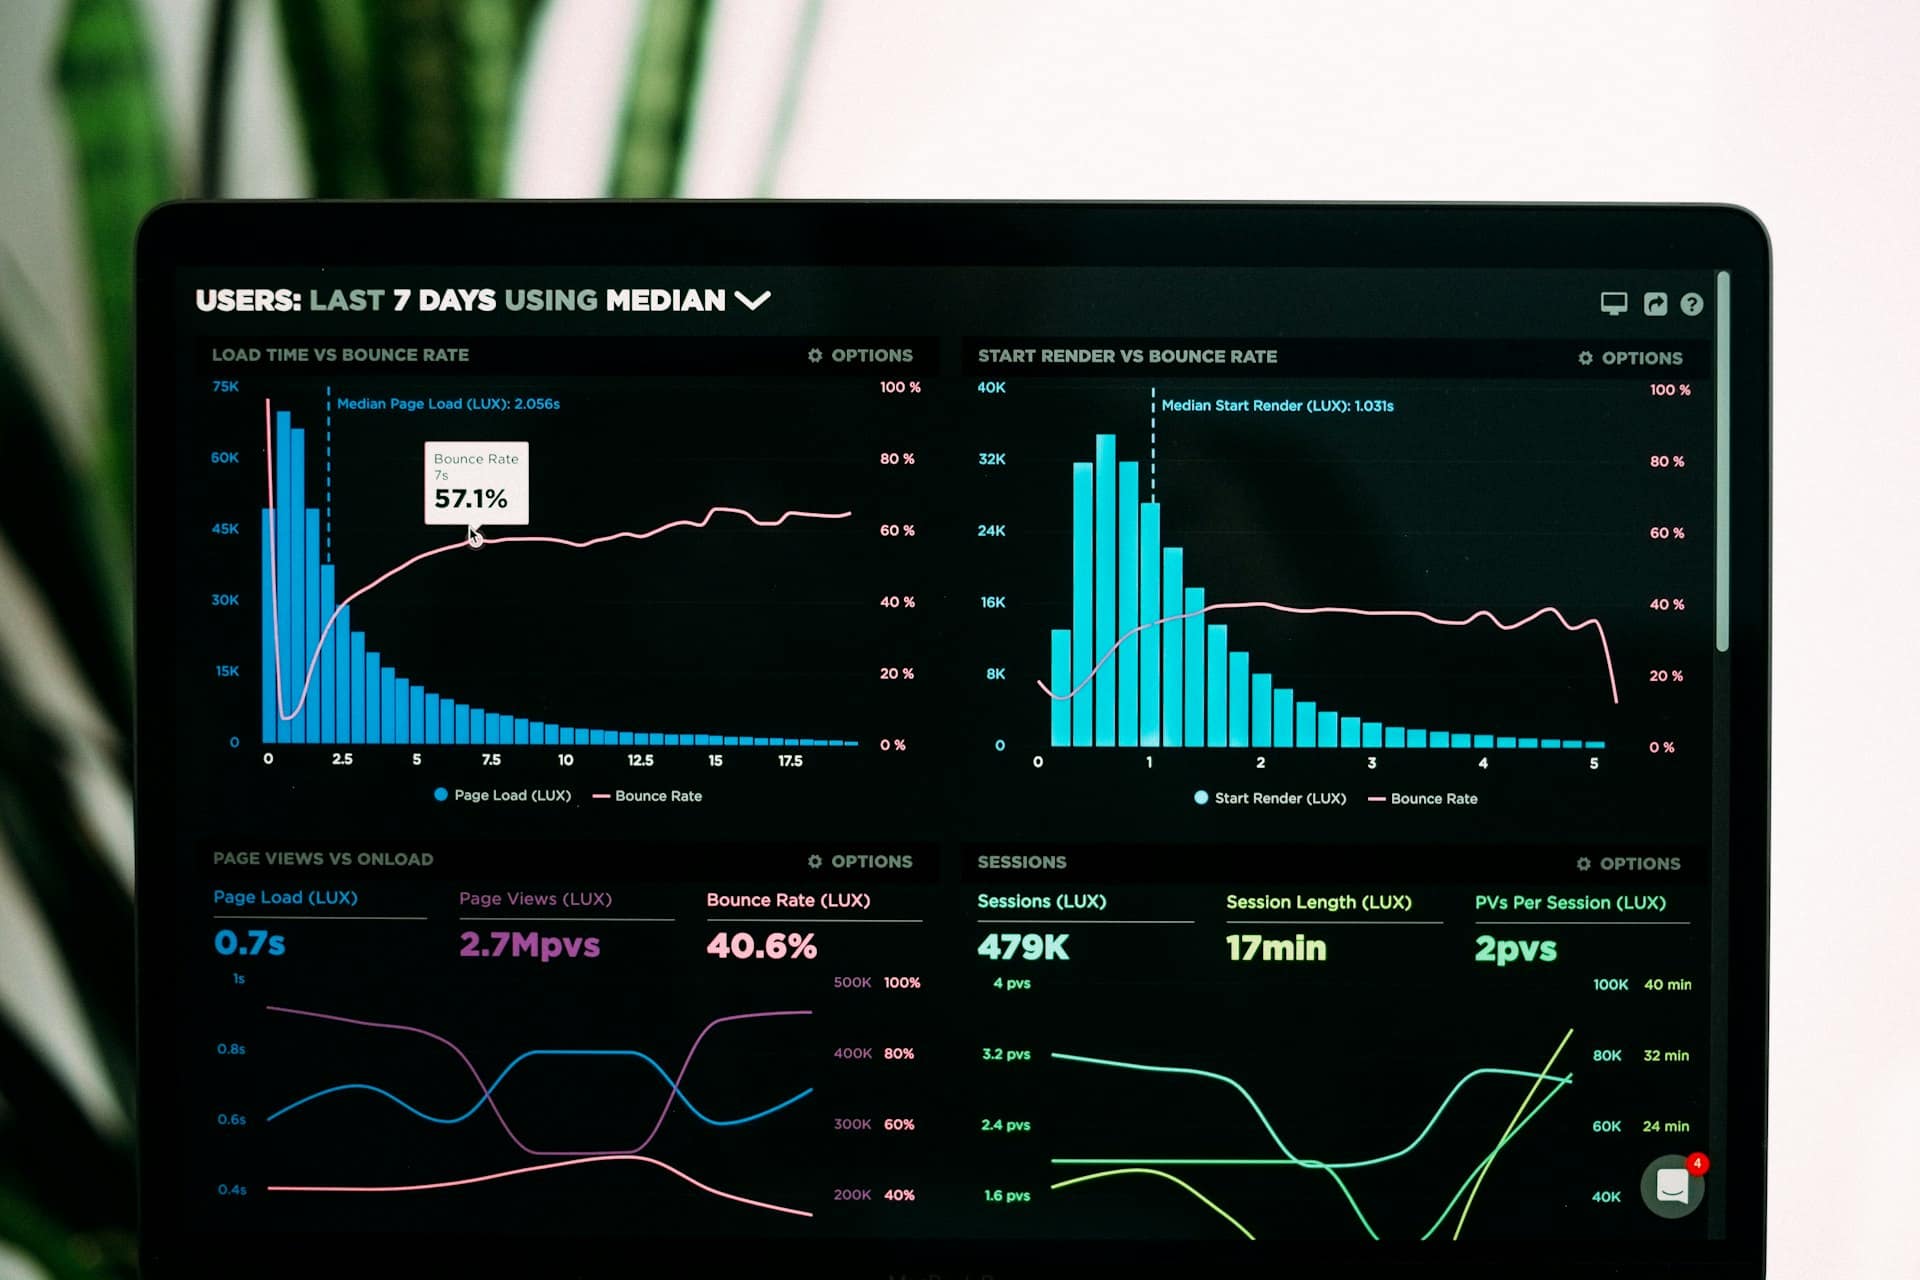
Combine agreed data from advertising platforms, website analytics and the CRM in one reporting view.
 Grepfox
SERVICES
Automate recurring marketing reports and dashboards. Connect your sources, check the tracking and use AI to prepare summaries your team can review.

If every reporting cycle starts with exports and spreadsheets, there is work we can help remove. We connect the sources you use, agree how the numbers are defined and prepare a view that answers your team’s recurring questions.
EXAMPLE TASK
Combine agreed data from advertising platforms, website analytics and the CRM in one reporting view.
EXAMPLE TASK
Review events, campaign parameters and lead stages so the team understands what each number represents.
EXAMPLE TASK
Set up dashboards or scheduled reports for your team or agency clients using consistent definitions.
EXAMPLE TASK
Use AI to describe changes in the data and flag questions for review, with the underlying figures available to check.
EXAMPLE WORKFLOW
The agreed data is collected into a report. AI prepares a draft summary of the changes. Your team checks the figures, adds context and decides which actions to take.
An example workflow; data availability determines what the report can show.
01
Agree who uses the report, which decisions it supports and what needs to be measured.
02
Check access, tracking and definitions. Identify gaps before designing the report.
03
Connect the sources and compare the results with the original systems.
04
Agree the refresh schedule, review process and person responsible for the report.
WHAT YOU RECEIVE
The agreed dashboard or report, its data connections and a guide to the metrics, sources and known gaps. If AI summaries are included, we show the team how to check and edit them.
We need access to the relevant data, your current reports and someone who can confirm the definitions. We discuss missing or inconsistent data before promising what can be measured.